212
La situacióndemográficadeMéxico2014
Cuadro2.
Edadde ingresoa eeuude losmigrantesadultosmayores
porgruposseleccionados, 2009-2012 (promedioanual )
País/ regiónde
nacimiento
Edadde ingresoa eeuu
De0a19
años
De20a49
años
De50a59
años
60omás
años
Total
Adultosmayores (Miles)
México
193
711
133
121
1159
Centroamérica
45
178
37
34
295
El Caribe
88
574
128
105
895
Sudamérica
33
240
67
40
380
Asia
152
1318
365
302
2136
Europa
473
1058
149
105
1785
Porcentaje (%)
México
16.6
61.4
11.5
10.5
100
Centroamérica
15.4
60.3
12.7
11.7
100
El Caribe
9.8
64.1
14.3
11.8
100
Sudamérica
8.7
63.2
17.6
10.4
100
Asia
7.1
61.7
17.1
14.1
100
Europa
26.5
59.2
8.4
5.9
100
Fuente: Estimaciones propias conbaseenu.s. Census Bureau and theu.s. Bureauof Labor Statistics,
Current PopulationSurvey
.
Fuente: Estimacionespropiasconbaseenu.s. CensusBureauand theu.s. Bureauof Labor Statistics,
Current PopulationSurvey
.
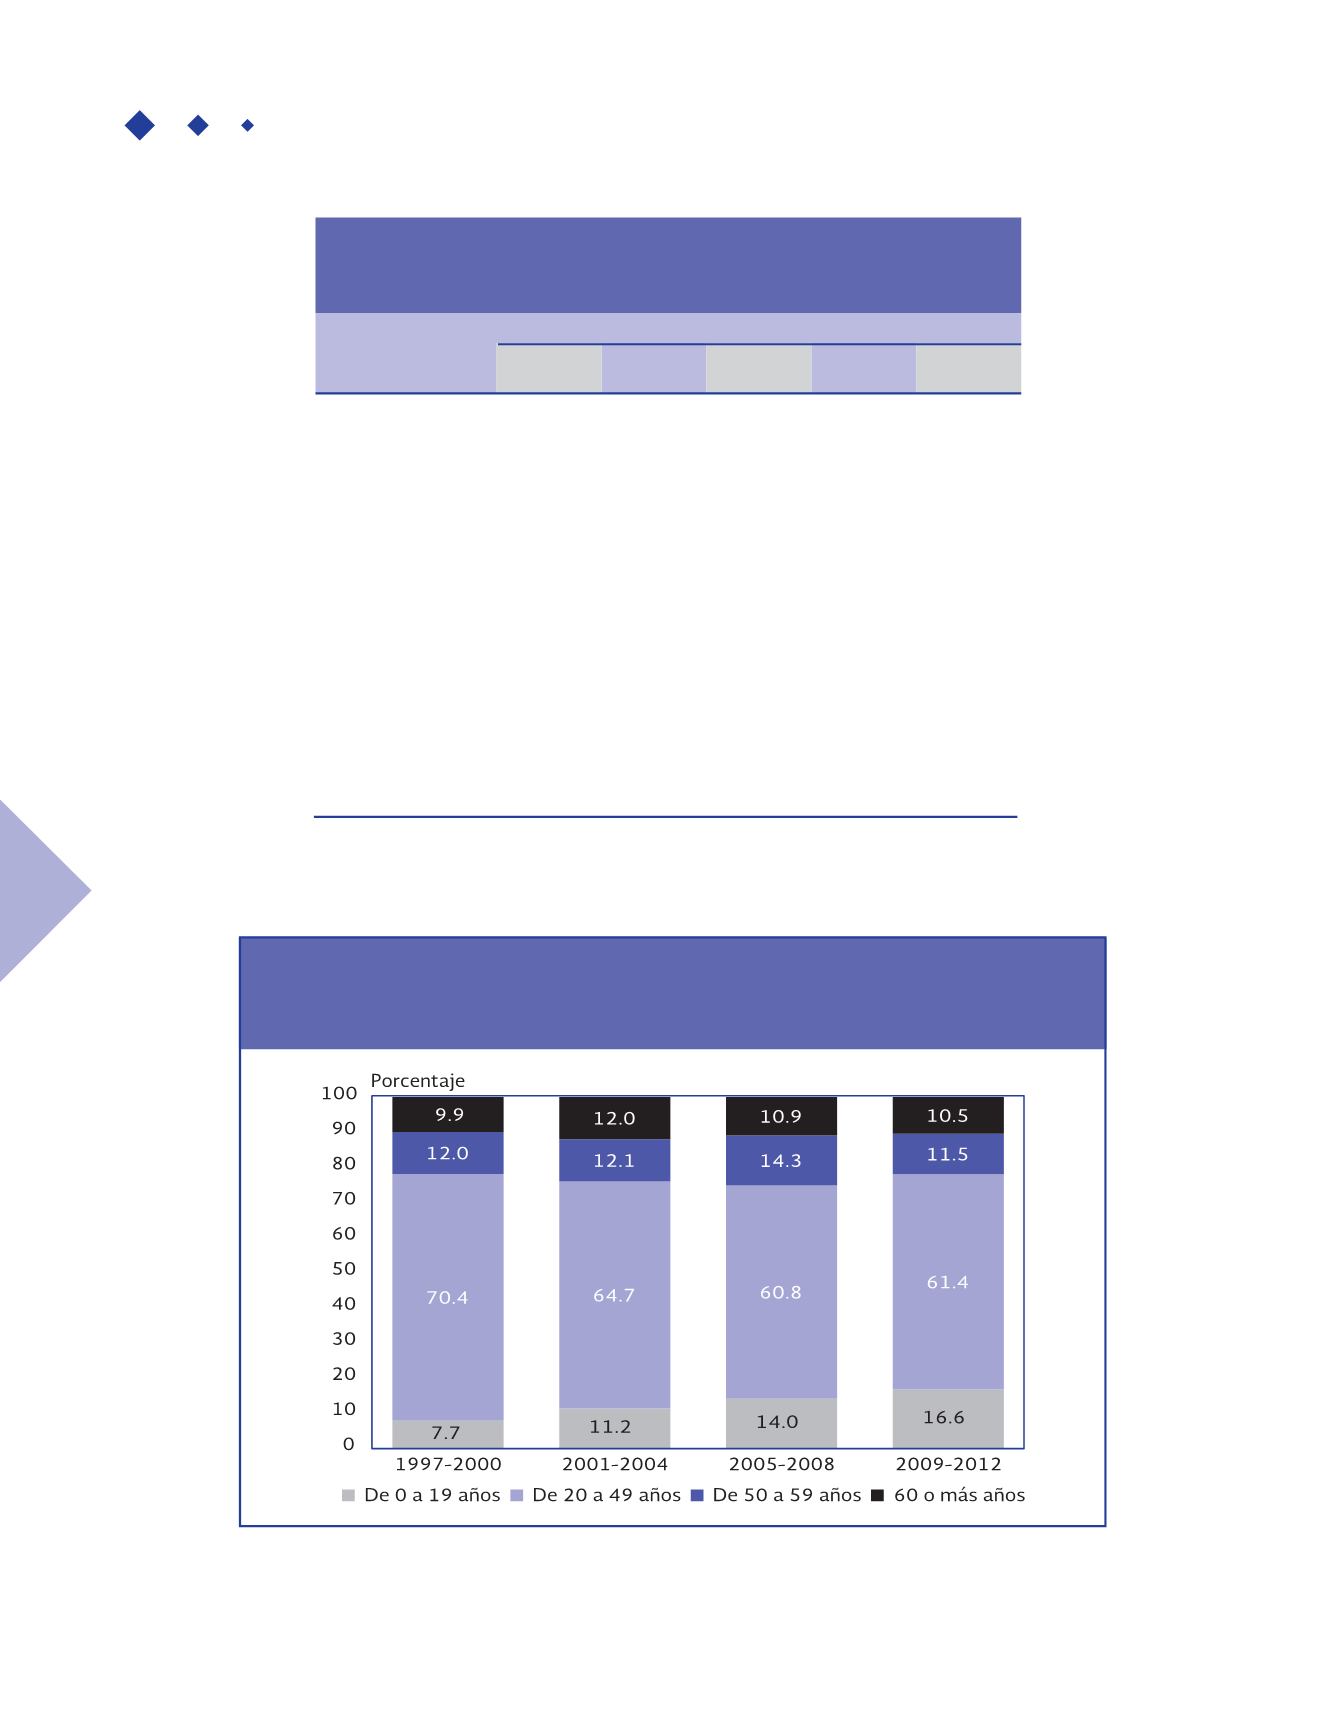
Gráfica3.
Edadde ingresoa eeuude losmigrantesadultosmayores, 1997-2012
(promedioanual)


